
Every technology company is on a mission to grow recurring revenue, and developing a firm understanding of how to stop software piracy can play a key role in product monetization.
Ultimately, unlicensed software is thought to cause a $46 billion black hole in global finances, so getting tough on compliance presents a huge opportunity to boost top-line growth.
However, compliance teams often struggle with knowing where to start, working against the speed and sophistication of crackers, unwitting buyers in search of discounts, and accidental pirates who own genuine products but exceed installation limits.
Yet, with the right framework and a commitment to succeed, it’s possible to build multi-million-dollar compliance programs that provide a stream of sales-ready leads, enabling you to convert piracy into profit.
As such, when discussing how to stop software piracy, you should consider the following steps:
- Implement clear policies to limit overuse.
- Utilize compliance analytics to detect piracy.
- Actively communicate with infringers to establish compliance.
- Partner with dedicated teams in different geographies.
Let’s dive a little deeper into each of these areas.
How to Combat Software Piracy by Addressing Overuse
Under-licensing of existing customers – often described as intentional or unintentional overuse – is an ongoing issue for suppliers debating how to combat software piracy.
In 2019, the European Court of Justice ruled that overuse constitutes IP theft. While this ruling favors suppliers, taking customers to court or pushing for full audits could put your relationship at risk, potentially creating a long-term loss for short-term gain.
However, misunderstandings and disagreements can be avoided altogether with these simple tactics that prevent overuse while protecting the customer relationship:
- Have clear definitions of software licensing terms and usage rights. Overuse often occurs unintentionally because there is disagreement on what license terms really mean. For example, unclear usage policies in testing or QA environments are frequently cited in compliance cases.
- Use technology to help report on usage and monitor compliance. Both suppliers and customers are often blindsided by compliance issues because the software does not use purpose-built licensing technology. With a robust software licensing service, suppliers can track overuse and monitor compliance.
- Use a common meter. With a clear licensing framework and entitlement management system, suppliers can be more transparent and provide customers with actual usage data, often available in self-service portals. This helps customers proactively stay compliant and allows for a much easier discussion should overuse occur.
The above measures can help you limit misuse from the outset, but inevitably you’ll also need to employ more robust methods to reap the biggest rewards.
Get the White Paper:
A Layered Approach to License Compliance
How to Stop Software Piracy with Data
Strategic growth is underpinned by maximizing opportunities within your existing base, and those misusing your product represent fertile ground when contemplating how to stop software piracy.
Most piracy occurs inadvertently, and commercial solutions such as Revenera’s Compliance Intelligence offer non-intrusive ways to generate indisputable forensic evidence, helping to ease the settlement process and maintain good customer relations.
When embedded into your product, Compliance Intelligence can immediately provide global visibility into the breadth and depth of your piracy and overuse problem – identifying the number of unique users on each machine, detecting the country of origin, pulling company domain-level data, and shedding light on the amount of infringement or usage activity over time.
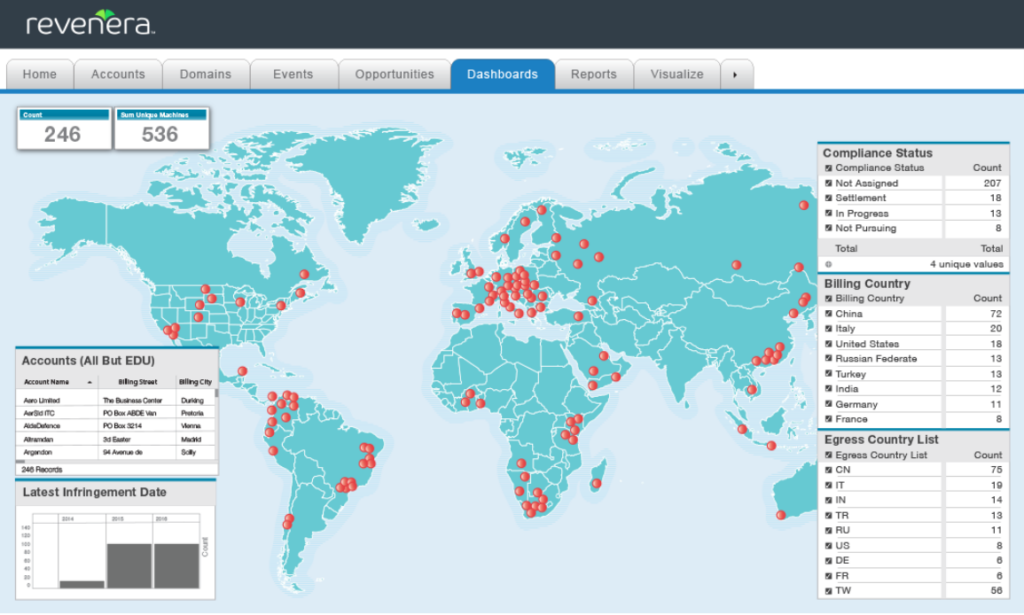
In short, Compliance Intelligence helps track how many infringers are using your software, how they’re using it, and how often. With these insights, you can identify quick wins with irrefutable evidence, as well as tracking and cataloging data over time – consistently providing high value leads to your sales teams and channel partners as part of revenue optimization efforts.
Using these methods, a manufacturing software developer recovered more than $2 million from its initial compliance program – a figure that continues to grow today. Similar ISVs, who have mature revenue recovery strategies, frequently increase top-line revenues by 10-25%.
The business advantage is clear, and with the right solution in place, data can help you tackle piracy to drive sustained growth.
Watch Now:
See how Bentley Systems transform infringement data into new customers
Reach, Educate and Convert
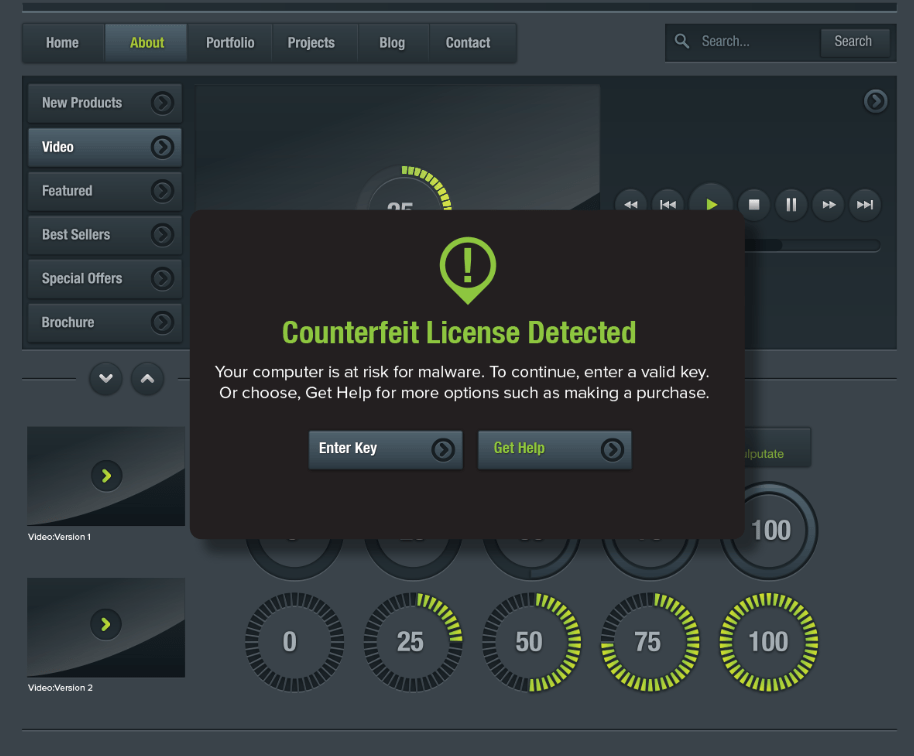
By using in-application compliance messaging, you can identify and segment users of unlicensed software to send alert notifications.
Messages can start out gently, informing users of the violation and directing them to landing pages on your website where they can learn more about their situation and resolve issues by making a purchase.
You also have the ability to escalate messages if the user doesn’t purchase after the first attempt, ultimately turning off functionality if they fail to convert after a specified time.
Keep in mind that these users have already been ‘sold’ on the value of your software – that’s why they’re using it. This is an important nuance to consider as you drive users to your landing pages.
They already understand your value proposition; now they need to be sold on the value of being your (paying) customer – upgrades, malware protection, access to support and training, input into new features, etc.
Many of these users have already paid for the software on a pirate site, so your tone of voice should acknowledge this by treating the user as a victim of piracy, not as a criminal. You may even want to offer a discount to further encourage conversion.
In addition to identifying opportunities for in-application messaging, you will likely discover larger organizations using unlicensed software – sometimes within existing customer accounts. In these cases, it makes sense to segment them out of your in-application messaging campaigns and reach out to them directly through your compliance or inside sales organization.
Again, the approach you take should likely acknowledge that they are the victims of piracy and that you want to work with them to make them part of your customer ecosystem.
For current customers, you’ll have the opportunity to alert them to the fact they’re using tampered, pirated software and the risks involved, as well as the opportunity to review their current levels of usage and needs as you look to nurture renewals.
Read the Guide:
Top 5 Best Practices for Assessing Your Software Piracy Risk
How Can We Stop Software Piracy Together?
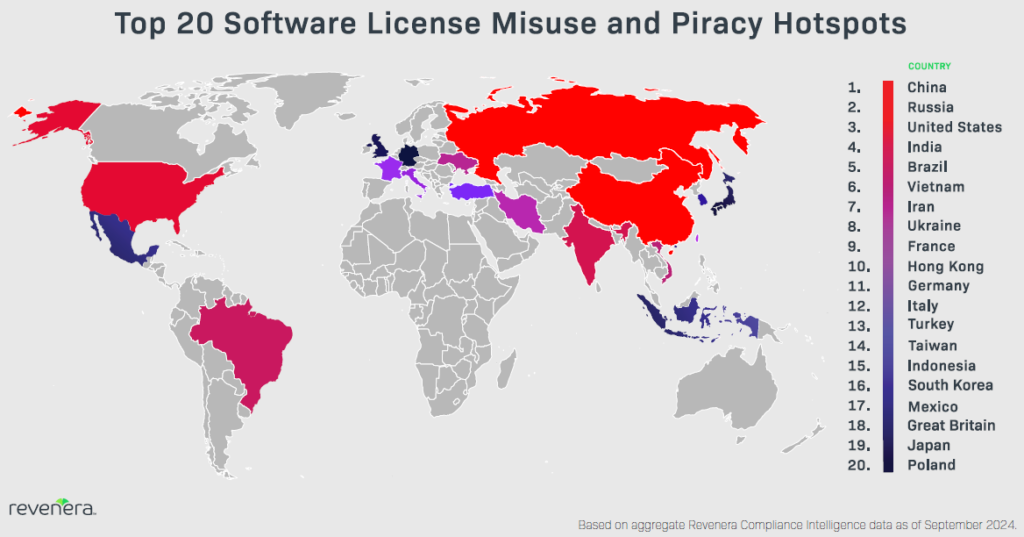
Software piracy is a global issue, and emerging markets present distinct challenges that may require legal enforcement and raids.
These tend to be very complicated situations that require specialized knowledge of local laws, customs, and human behavior, but Revenera’s Revenue Recovery Services team is well-equipped for success in these regions, working with partners like the Software Compliance Group to generate tens of millions of dollars for customers suffering piracy in BRIC nations (Brazil, Russia, India, and China).
With so much at stake, it’s not surprising that leadership teams increasingly contemplate how to stop software piracy to stimulate growth, but revenue recovery shouldn’t be a guessing game.
On-Demand Webinar:
Building License Compliance Programs in a Cloud World
An Uncomfortable Truth
So how do you stop software piracy?
The fact of the matter is, hobbyist hackers and hardened criminals will always try to crack your code, but maybe that’s not such a bad thing.
As outlined above, tracking piracy and acting on infringement data can boost your sales pipeline with red-hot leads, which is precisely what you need when trying to grow recurring revenue.
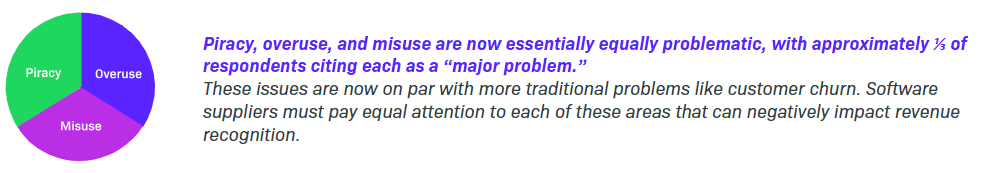
However, the Software Piracy and Compliance 2025 Outlook survey indicated piracy, overuse, and misuse remain significant causes of revenue leakage – with 1 in 3 tech companies reporting each as a “Major Problem” – so there’s plenty of room for improvement throughout the industry.
If you’re serious about taking action, Revenera’s Compliance Intelligence allows you to detect software piracy with:
- Visibility into software that has been tampered to enable unlicensed use.
- Real-time alerts when a new version of a point release has been cracked, as well as missing information for identifying users.
- Detailed, forensic evidence on overuse and piracy across divisions and locations, delivered in a way that is fully consistent with your contract rights, and without the infringer knowing.
- Functionality to manage pirate sites as a profitable distribution channel, with in-app messaging and the ability to degrade software features.
The solution provides insights into where unpaid usage is occurring, who’s getting value from your applications, and how they’re being used – empowering you to make data-driven decisions about the best opportunities to pursue.
Watch the below video to learn more about how to stop software piracy and contact us if you’d like to speak to the expert revenue recovery team.