Product teams work tirelessly to build products that customers will love. But how do they know when it is time to celebrate their success? Or how do they know when they may need to go back to the drawing board and try again? Software usage analytics offers many key metrics and insights for product teams, but one of the most important is the ability to measure the level of user engagement with your application.
What is User Engagement?
User Engagement is defined as the frequency and length at which a user interacts with a website or an application. Depending on the product, engagement can be measured by a variety or combination of activities such as downloads, clicks, and shares.
How to Calculate User Engagement?
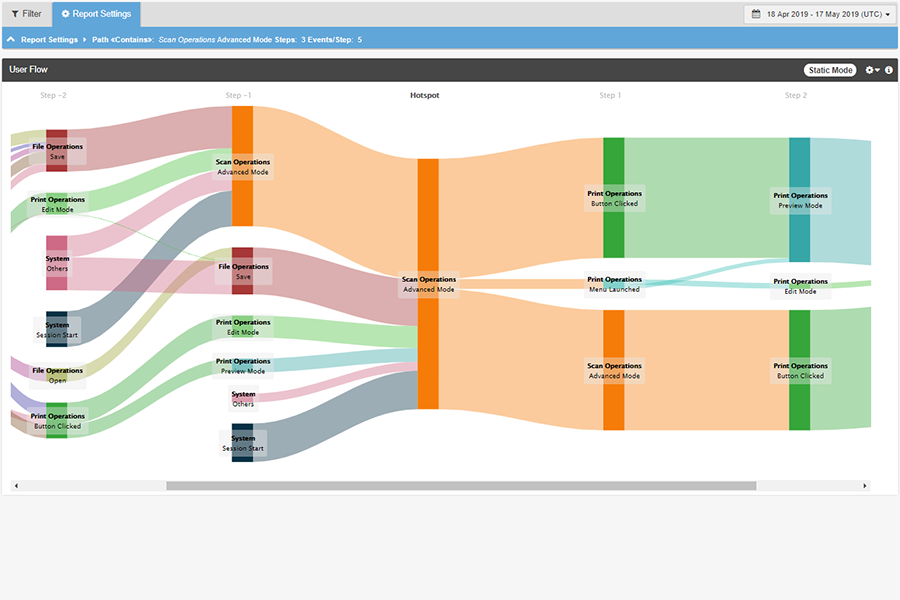
The first step in calculating User Engagement and gather Usage Intelligence is determining whether you want to focus on user engagement with the overall application or on specific features within the application.
![]()
Revenera Monetization Monitor: 2026 Outlook
501 senior leaders at global technology companies share their thoughts on monetization trends for 2026 and beyond. See the results >>>
Next, you need to understand the general expectations or goals based on your specific product.
Application Metrics
- Expected Session Interval: Is your application designed for use every day or on a more cyclical basis? How long do you think users spend between application sessions?
- Typical Session Length: How long do you expect users to engage with your application in a given session?
- Different User Personas: Are there different types of users that will impact the levels of engagement metrics you will see?
Feature Metrics
- Feature Stickiness: Which features should be providing users with the most value (and are they being used)?
- Feature Retention: Which features are actually bringing customers back again and again, that they can’t live without? Was this behavior expected?
- Undiscovered Features: Are there features that are not being used or have zero engagement?
Establishing a Baseline and Monitoring Your User Engagement
Once you have identified the parameters for your inquiries, you will want to measure key performance metrics and get your benchmark data set so you can compare how your application and feature engagement is increasing or decreasing over time:
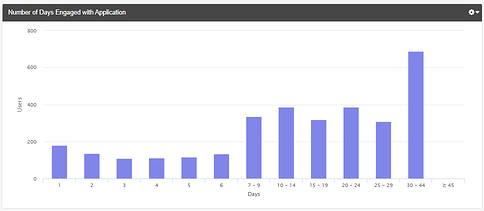
- Number of days engaged with your application over a given time period: By analyzing this usage data, you can see if your users are incorporating the application into their daily routine, or using it in a more sporadic nature; compare this to your expected behavior to determine if engagement levels are healthy or not.
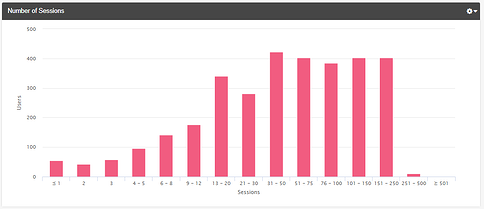
- How many times users have launched your application over a given time period: By seeing the distribution of sessions you can see if you have a light or heavy amount of application usage, and how many times users are coming back and launching the app overall to get their jobs done.
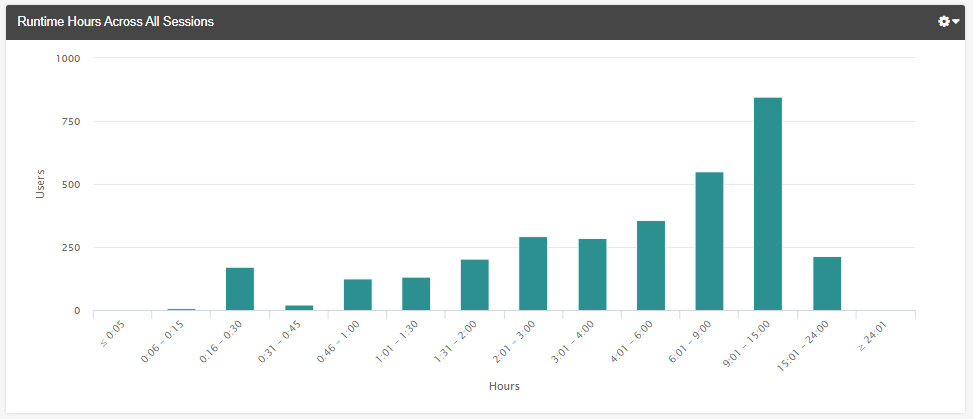
- Number of hours users have spent interacting with your application: Depending on your software, it may naturally lend itself to long sessions, or this data can be another indicator of how much value users are getting. Significant time spent in the app could mean users are happy, but if it is longer than expected, you may need to drill down and determine whether you need to address efficiency in the flow of your application.
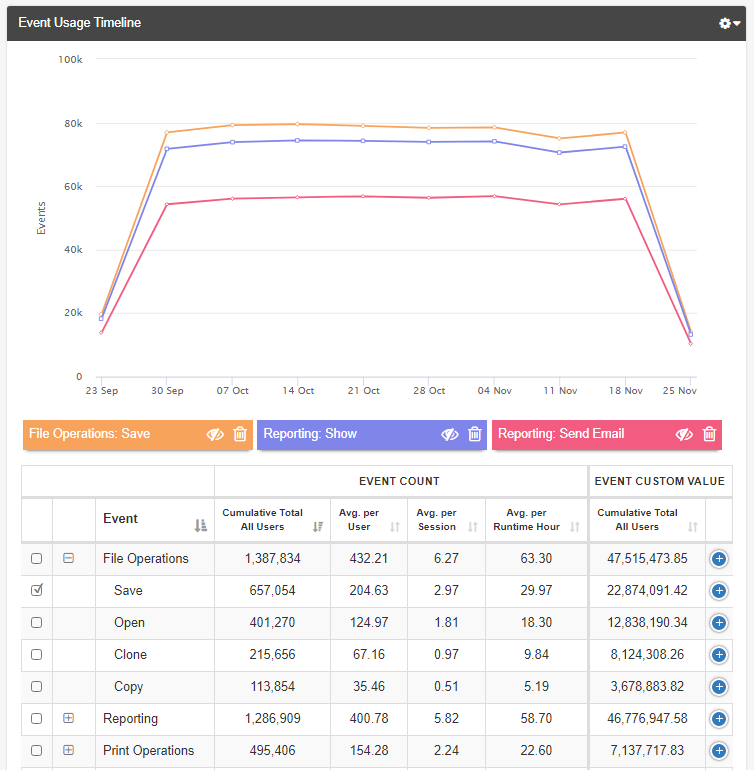
- Counts of feature usage (including metrics like cumulative total for all users, average per user, average per session, and average per runtime hour): By analyzing which features get the most use per session, you can start to see which are your stickiest ones and prioritize efforts to make sure they stay sticky (and track them before and after product changes to make sure usage stays high). You can also measure feature popularity more generally over time to get an idea of which features are the ones that continue to bring users back to the application.
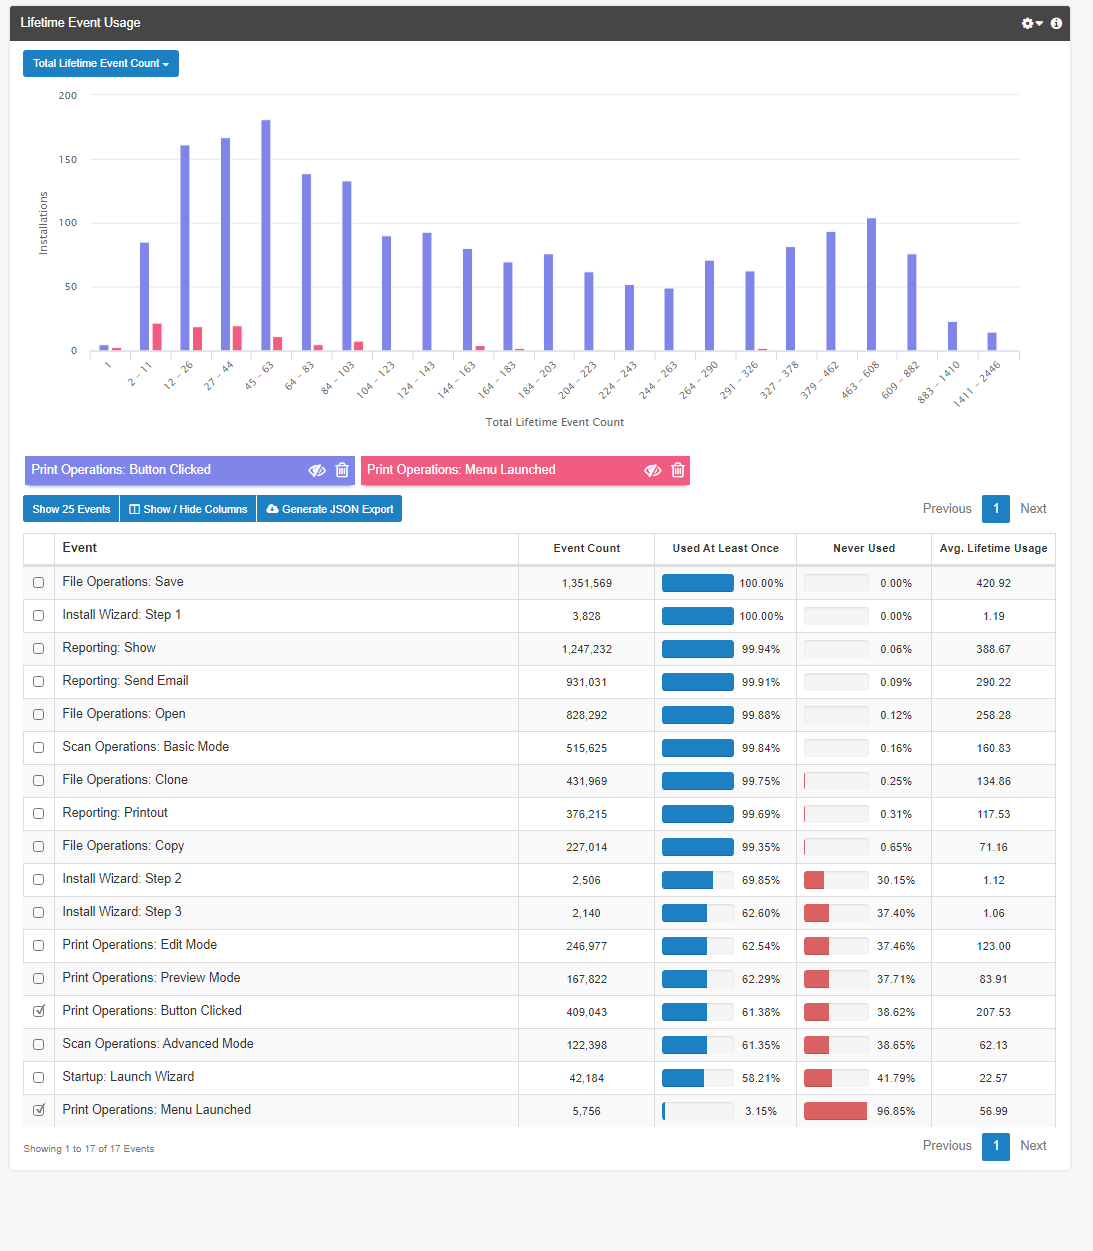
- Which features are used by almost everyone, and which are not discovered or underused: On a feature-by-feature basis you want to analyze those that are universally adopted and also those that may not be getting the usage you expect. If you expect that a feature should deliver high value and it is not seeing the usage levels you would expect, you may need to find ways to make it more accessible for example.
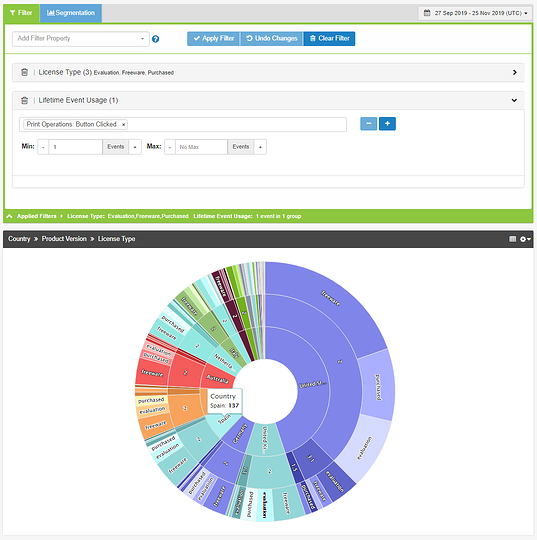
- Variations by types of users: Analyzing feature usage by different user types can be very important as different personas can use your product in different ways, and user engagement metrics can vary by these types. Adding in segmentation and filtering to your feature analysis can help understand any differences or similarities in behavior by these groups.
How to Increase User Engagement?
Charting application and feature usage over time can uncover general usage trends or spotlight significant changes (positive or negative) in overall user engagement. Once you have calculated user engagement tracking implemented, you can answer questions like these:
We have all seen the estimates that customer acquisition costs five times as much as retaining an existing customer, and that 80 percent of profits come from 20 percent of your customers. While user retention is a topic that we will cover in its own article, measuring user engagement is central to that effort. Running a regular, targeted customer data analysis project will help you better understand user engagement and help your product team build the applications that will delight your customers and build long-term customer value. Ready to start tracking user engagement? Request a demo with one of our analytics experts or start a free trial today.
Common Questions
What does user engagement mean, and why does it matter?
User engagement refers to how often and how long users interact with your application or website. It matters because it signals whether your product is delivering real value and meeting user expectations.
How can product teams calculate user engagement effectively?
Teams can start by deciding if they want to measure engagement across the entire application or focus on specific features. This choice helps determine which metrics and benchmarks will provide the most actionable insights.
Which metrics provide the most insight into user engagement?
Important metrics include session frequency, session length, total hours spent, number of launches, and feature usage trends. These indicators reveal patterns in user behavior and highlight areas for improvement.
Why is ongoing monitoring of engagement critical for success?
Monitoring helps identify whether engagement aligns with goals, spot underused features, and detect trends that signal when to improve usability or add value.
What strategies can increase user engagement over time, and why are they important?
Improving engagement requires analyzing usage trends to understand customer behavior, refining the UI to meet evolving needs, and incorporating feedback into product development. These strategies not only boost satisfaction but also help convert trial users into loyal customers, which is essential since retaining existing customers is far more cost-effective than acquiring new ones.