
Software usage tracking used to be fairly straightforward. You collected data, generated reports, and reviewed them periodically to understand how your software was being used.
That approach no longer holds up.
As technology companies move toward SaaS, hybrid, and usage-based monetization models, usage data has become central to how value is delivered, measured, and renewed. The question isn’t whether you’re tracking usage, it’s whether that data is giving you a clear, shared view of what’s actually happening across your customer base. Detailed software usage tracking should reveal engagement levels, feature adoption, service denials, and upcoming renewals – allowing you to identify churn risk and potential expansion opportunities.
Recent updates to the Monetization Analytics Dashboard in FlexNet Operations reflect this shift, focusing on making usage insight easier to access, interpret, and share across teams.
Key Benefits of Software Usage Tracking and Reporting
- Clearer insight into customer value: In modern software businesses, revenue doesn’t stop at the point of sale. Renewals, expansion, and long‑term growth all depend on how customers adopt and use what they’ve purchased. Software usage tracking helps teams see whether customers are getting real value, rather than relying on assumptions or surface‑level signals.
- Earlier visibility into risk and opportunity: Usage patterns often tell a story long before renewal conversations begin. Strong adoption can point to expansion potential; while declining or uneven usage can highlight risk early enough to act. With the right reporting in place, teams can move from reactive conversations to proactive engagement.
- More confident, data‑driven decisions: When usage data is clear and accessible, decisions become grounded in evidence rather than anecdotes. Product, revenue, and customer success teams can align around the same understanding of what’s working, what isn’t, and where to focus next.
How to Track Software Usage More Effectively
The real challenge isn’t collecting data; it’s making it usable.
Usage insight is often fragmented across systems and reports, with each team seeing only part of the picture. Product teams might focus on feature adoption, finance teams on entitlements and revenue, and customer success teams on engagement signals. When those views aren’t connected, teams are left piecing things together manually, often without the clarity or time needed to act.
In this kind of environment, the data quickly loses impact. Static reports and siloed insights make it difficult to answer even basic questions about how customers are using what they’ve purchased. What’s needed isn’t more tracking, it’s shared visibility that teams can trust and interpret in their own context.
Modern, flexible software usage tracking helps close that gap. Not by giving everyone the same dashboard, but by creating a shared operational view of entitlements, usage, and adoption that different teams can explore the same underlying data in ways that align with their role and priorities. Customizable views and interactive experiences make it possible for teams to work from a single source of truth, while still focusing on the metrics and KPIs that matter most to them.
Renewal risk becomes visible earlier because declining adoption or unmet entitlements stand out in real time. Expansion opportunities are easier to identify because usage patterns clearly show where customers are getting value, and where there’s room to grow. Product decisions become more grounded, guided by how software is actually being used rather than assumptions or anecdotal feedback.
Software Usage Reports That Go Deeper
Revenera’s Analytics Dashboard offers several smart software usage tracking reports, including:
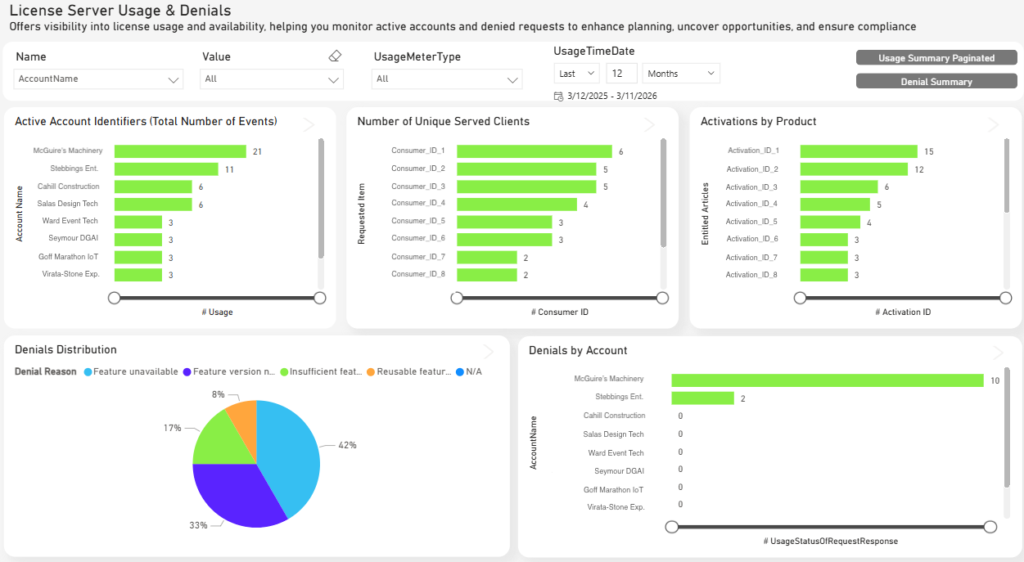
- Service Denials: When customers are denied access due to insufficient capacity or use rights, this is a clear signal of an upsell or cross-sell opportunity – especially if it’s repeated behavior over a prolonged period.
- License Server Usage: Drill into specific feature usage to see whether key customers are making the most of your product, or if action is needed to boost adoption. This data can also inform overage billing scenarios.
- Fulfillment: By comparing available quantities to activations, you can see if customers are maxed out and could benefit from more, or if you need to intervene to reduce churn – either by driving adoption or recommending right-sizing, which improves satisfaction and lowers cancellation risk.
- Renewals: A real-time view of upcoming renewals helps your team stay ahead. You can also conduct customer churn data analysis by filtering churn by region, allowing you to audit expired entitlements and assess your options for re-engagement campaigns.
Each report supports interactive drilldowns and filtering by key attributes, such as Product and Account, making it easy for teams to derive insights relevant to their specific needs. These reports become even more powerful when paired with conditional notifications. Instead of reviewing trends after the fact, teams can define rules, such as repeated service denials over time or declining usage ahead of renewal, and receive alerts as soon as those conditions are met, enabling faster, more targeted follow-up.
![]()
Revenera Monetization Monitor: 2026 Outlook
501 senior leaders at global technology companies share their thoughts on monetization trends for 2026 and beyond. See the results >>>
Ready to Get Started?
As analytics capabilities continue to evolve, focusing on visibility and accessibility lays the groundwork for deeper insights in the future. More advanced analysis, predictive signals, and intelligent decision support all depend on having a solid foundation in place first.
The latest Analytics Dashboard update is built with this reality in mind. A more modern, interactive experience makes it easier to explore entitlements, usage, activation, and renewal data in one place, with customizable views that reflect different products, customers, and business priorities. This helps teams work from a shared, real‑time view of adoption and value, rather than relying on static reports that quickly fall out of sync in hybrid monetization models.
If you’d like more information on how Revenera’s software usage tracking capabilities can help you grow recurring revenue with insights delivered to your inbox, let’s talk.