By far the de facto name in analytics is Google Analytics, and for good reason. As a solution, Google Analytics provides many benefits to users with a wide variety of reports, from out-of-the box metrics to fully customized reporting. It starts at a nice price, too: free (if you are ready to live with some limitations, such as data sampling, no service-level agreement, no export options, etc.). It is not surprising, therefore, that a lot of companies seek it out as their first option when determining which analytics solution to use in their product. For companies that have wholly web or mobile-based applications, this is sometimes the first and last stop in their search for analytics, as it fits their solutions nicely. But producers of desktop software applications might find that Google Analytics is not the best fit for their technology.
Challenges in Using Google Analytics on Desktop Applications
Google Analytics was built specifically to track website traffic and is thus not a purpose-built solution for desktop applications. As a result, it requires significant effort and customization if one was to even attempt to use it to track a desktop application. In a previous article we went into this in detail, but boiling it down to the most salient points, the reasons why Google Analytics is not a good choice for the desktop software producers are:
- It requires clients to always be constantly connected for events to be tracked (anything that is tracked while disconnected is lost).
- It uses cookie-based session tracking.
- It is built to track how users move through pages.
Desktop applications often do not satisfy any of these conditions. They can frequently run offline, or certainly do not require an always-on dependency to be connected. Cookies are not set by desktop software applications the same way that web-based applications and sites do. Most applications will have different sections or modules, but the way users navigate can be less linear than the typical page-to-page flow seen in applications that run in a browser.
Differences in Reporting – Specific Examples
To further illustrate the differences in how analytics can be measured and displayed for different applications let’s look at some real-world examples from Revenera Usage Intelligence and compare and contrast how the methodology of a web analytics platform, such as Google Analytics would impact the data being collected and the actionable results produced.
User Flow Reporting
The basic premise of any “flow” report is to find out how users get from point “A” to point “B” in your application, and the results of interpreting the analysis of the flow should illustrate if there are any issues in navigation or the user experience (UX) that you can improve. Maybe they are finding themselves at a dead end, maybe they are taking a very circuitous route to accomplish a goal, or maybe there is just an errant UI step here and there that is unnecessary (e.g., if you see a series of repeated function calls it may point to the need for some sort of batch functionality).
Regardless of the issues that may be surfaced, the method of data collection needed in a desktop application is unique to the way these applications are constructed. A desktop application may not have a very linear path to getting things done. You may have several navigation elements in play from menus to tool panels, to ribbons of buttons, or even keyboard shortcuts that can enable people to jump around significantly all while viewing what feels like the same physical “page.”
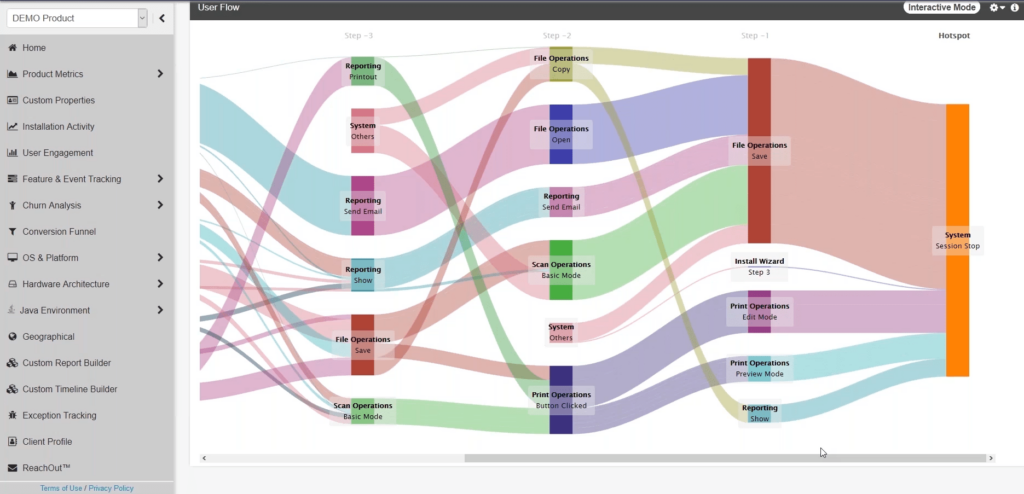
In Usage Intelligence, the way that User Flow is determined is when each event or action happens in your application, it is recorded, and then presented in a visual representation of the order it occurred in relation to other events. You can choose a point of interest (hotspot) in your application to analyze the events that happened immediately before, after or around that hotspot, and if there are events you wish to exclude (such as system-generated events that may confuse data). The end result is the ability to view how navigation occurs in your application, from very granular to high-level trends.
How Google Analytics Differs
In Google Analytics as well as other web applications, the default setup is to track a user’s flow from one point to another by the pages they hit to get there. If you do track all the events happening in your application, you can plot that path as well, but you need to consider that if there is any loss of connectivity, then the data will surface incomplete paths.
Additionally, excluding events from the paths cannot be done ad hoc; it must be done by creating or updating filters. Google has also fixed limitations in its event flow report, such as forcing you to show the top X events, with things shrinking on every step from then on. At some point, you might end up with a step that only contains “others,” and you cannot get to more granular data (due to sampling used by Google Analytics, all the rest goes in “others”).
With Usage Intelligence, you can keep investigating down a specific path of interest by extending the path interactively.
Churn Analysis
Understanding the full picture of users that churn or abandon your product can help identify significant opportunities for product (and onboarding) improvement, whether it be at the aggregate product level, the unique attributes of churned users in terms of their profile or behavior. At the core of churn analysis is building user profiles and tracking all of their interactions with your product from their environment up to and until the point at which they churn. Churn analysis in Usage Intelligence includes three main reporting suites:
- Churn Rates for New Installations – calculates the total churn of users in your product from the time when they installed the product and were first active until the time they churned.
- Churned Users Profile – shows the distribution of user attributes such as operating system, location, hardware, and product metrics like version, and license data.
- Churned User Activity – illustrates the typical engagement that users had with your application before they walked away from your product.
By tracking all users and keeping a history of all of their interactions until the point of churn, Usage Intelligence gives the complete picture of what a typical lost user looks like and helps you determine the factors that lead to churn so you can take steps to reduce it and increase overall user retention.
How Google Analytics Differs
While Google Analytics is able to track churn and retention of visitors of a web property in its Cohort Analysis, it is inherently unable to achieve the same data set on a desktop application. The major hurdle it encounters is that when used to attempt to track a desktop application, the cookie-based memory of previous visits does not exist, and all users will appear new every time that your application is launched; therefore, the historic profile cannot be created for desktop applications. While it may be able to track a custom property such as an ID, it is unable to connect the dots in the story of user retention and churn.
Feature and Event Tracking
One robust reporting suite in Usage Intelligence is the set of reports that analyze feature usage patterns. The event usage timeline shows you the relative popularity of different events over time and some relevant metrics as to the popularity across the user base and session data. This can help you understand the adoption or abandonment of certain features in your application and where to focus your efforts. The second report of Lifetime Event usage has a more user-centric approach to its data set. It will give a distribution of the magnitude of use each feature has (which can also provide some indication of lifetime popularity). Also, it will surface features that have never been discovered or are under-discovered, as well as those that everyone uses, which helps to verify assumptions on the popularity of features. The Lifetime Feature Usage report can also filter and segment for more granular data analysis. For example, you can analyze by user base or segment by version to see how a UX fix in a version update changed the popularity of a feature by exposing it more or making it easier to use.
How Google Analytics Differs
When it comes to feature usage, one of the things that Google Analytics can track in desktop applications is the relative popularity of a feature over time. Since it is an event-driven count, and the count can be sent to the reporting interface when connected, you can get relative usage in the event reporting in Google Analytics. It may not give you an accurate history of the users who have or have not used it, they could be older legacy users or just coming in for the second time, nor can it give you usage frequency by different user groups, but it can give some rudimentary data.
Product Metrics
Out of the box, Usage Intelligence is built to track the entire lifetime of user engagement with your application. As users upgrade from one version or build to the next it keeps track of those users and can give a picture of all the different versions you have users running on. As a result of historical user tracking you can also understand the New, Active, and Lost users of your application within a specific timeframe to see the overall product health.
How Google Analytics Differs
Similar to event tracking, Google Analytics can track the number of times a particular version of a desktop application is launched, but it is not going to understand the same historical basis of tracking on a per installation basis, or users that have moved from one version to another as it will merely report back on the event happening and the same limitations of not having the lifetime view of the user apply in product metrics as do in feature tracking and really all other reports.
In-Application Messaging
ReachOut In-Application Messaging
Though not actually a report per se, the functionality provided by Usage Intelligence through ReachOut In-application messaging is worth noting. A layer of functionality on top of your desktop application analytics, it provides a fully targeted direct-to-desktop messaging platform that allows for segmentation based on any of the data you collect. Subsequently, whether or not customers have received particular in-app messages from you can be used to filter data in other reports as well, letting you test the effectiveness in onboarding messages designed to expose new users to your most valuable features.
![]()
Revenera Monetization Monitor: 2026 Outlook
501 senior leaders at global technology companies share their thoughts on monetization trends for 2026 and beyond. See the results >>>
How Google Analytics Differs
While Google Analytics does integrate with many third parties, in-application messaging in web and or mobile applications is not a native service within the application, and unfortunately, there are no third-party providers that enable the delivery of messages to desktop applications.
Unique Data Requirements
Personally Identifiable Information
The last main point of comparison between Usage Intelligence and Google Analytics in regards to tracking desktop applications centers on the ability to collect Personally Identifiable Information (PII). With Google Analytics on desktop or on the web, you are not able to collect personally identifiable information. It is possible to have a custom user identifier similar to the Client Profile ID within Usage Intelligence, but you are unable to trace that back to who the end user is specifically. Some companies find great benefit in knowing this end-user information when trying to identify how specific people are using an application and if proper notification is given upfront to end users with the ability to opt in or out, collecting this personally identifiable information is not only possible in Usage Intelligence but also permissible. A feature you may want to have within your desktop analytics reporting suite.
Conclusion
In conclusion, Google Analytics is a very powerful and best-of-breed analytics platform that provides many organizations with powerful analytics, but it is primarily geared and most useful to those who are trying to track purely browser-based applications. When thinking about analytics in a desktop application, it is important to select an analytics solution built for the specific needs of your product, that will deliver the analytics desktop applications need and provide the data storage solutions your business may require.
Common Questions
Why is Google Analytics not ideal for desktop applications?
Google Analytics was designed to track website traffic and relies on factors such as constant connectivity, cookie-based session tracking, and page-to-page navigation. Desktop applications often run offline, do not use cookies in the same way, and have non-linear navigation paths. These differences make Google Analytics difficult to adapt for desktop software without significant customization.
How does Usage Intelligence handle user flow reporting compared to Google Analytics?
Usage Intelligence records every event or action within a desktop application and presents them in a visual sequence, allowing analysis of navigation patterns around specific hotspots. This approach supports granular investigation and excludes irrelevant events interactively. In contrast, Google Analytics tracks user flow primarily by page visits and has limitations such as incomplete paths during connectivity loss and fixed event display constraints due to sampling.
What advantages does Usage Intelligence offer for churn analysis?
Usage Intelligence builds complete user profiles and tracks all interactions until churn occurs, providing insights into churn rates, user attributes, and engagement patterns. This helps identify factors leading to abandonment and improve retention strategies. Google Analytics, however, cannot maintain historical profiles for desktop users because it relies on cookies, causing every session to appear as a new visit.
How do feature and event tracking differ between Usage Intelligence and Google Analytics?
Usage Intelligence offers detailed reports on feature usage, including event timelines, lifetime usage, and segmentation by version or user group. This helps uncover underused features and validate assumptions about popularity. Google Analytics can track event counts for features, but lacks the ability to provide historical user-level data or segment usage frequency across different user groups.
Can Google Analytics provide in-application messaging or collect personally identifiable information?
No, Google Analytics does not support native in-application messaging for desktop applications and cannot collect personally identifiable information. Usage Intelligence, on the other hand, includes ReachOut for targeted in-app messaging and allows the collection of PII with proper user consent, enabling deeper engagement and personalized analytics.